
IESE Insight
An AI debt wave meets uneven balance-sheet risk

The hyperscaler bond binge since 2025 has turned AI infrastructure into a major growth engine. But what happens next?
By Christian Eufinger and Yuki Sakasai
Artificial intelligence (AI) has rapidly moved from being a software story to being a capital-markets story. Over the past 18 months, the Big Five U.S. hyperscalers — Alphabet, Amazon, Meta, Microsoft and Oracle — have funded an unprecedented buildout of data centers, GPU and power infrastructure, increasingly making use of debt rather than internal cash flow.
By the end of 2025, hyperscaler gross corporate-bond issuance had topped $100 billion, more than three times the average of the prior five years. AI-related debt is now estimated to account for roughly 30% of net new investment-grade (IG) supply in the U.S. dollar market.
Added to that, there is a fast-growing pool of off-balance-sheet private credit, what the Bank for International Settlements has labeled “shadow borrowing.” This ties hyperscalers to nonbank lenders and insurers in ways that were largely absent before 2024.
Many questions remain: How big is the AI debt wave, and what does it look like deal-by-deal? Are credit markets pricing the new risks? Beyond the issuers themselves, which sectors of the real economy are most exposed to AI disruption, and do those exposures line up with high or low corporate leverage today?
A step change in hyperscaler debt issuance
Until 2024, big U.S. tech firms were among the lightest borrowers in the IG market. Their operating cash flows comfortably funded CapEx and shareholder distributions. That changed in 2025, when hyperscaler bond issuance jumped from $20 billion to $109 billion, of which about $90 billion was issued in the final four months of the year.
This trend continued in 2026: The amount of gross issuance already exceeds the whole of 2025 — around $152 billion in the first four and a half months. Some $300 billion is expected to be issued this year. Issuance has been long-dated — most maturities are five years and longer — locking in funding for multiyear AI infrastructure programs and substantially extending the duration of the IG market.
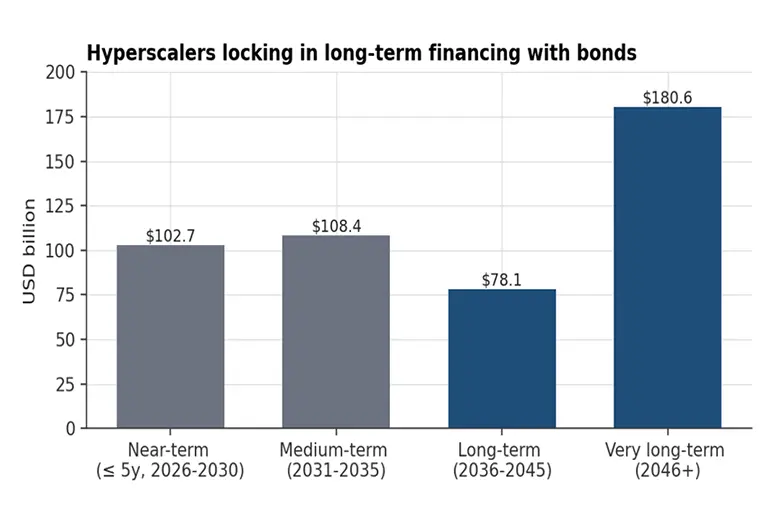
The pace of individual transactions is just as striking. Meta sold $30 billion of bonds on October 30, 2025, drawing a $125 billion order book, and printing a 30-year bond at 98 basis points over Treasuries, and a 40-year bond at 110 basis points. Oracle issued one at $18 billion in September 2025 and followed up with $30 billion in February 2026. Alphabet raised $25 billion in November 2025 and, earlier in February, became the first technology issuer in decades to sell a 100-year bond. And Amazon made capital markets history.
Alongside on-balance-sheet bonds, hyperscalers have layered roughly $65 billion of off-balance-sheet financing — most visibly Meta’s $27 billion private-credit joint venture with Blue Owl to fund the Hyperion data center campus in Louisiana, and Oracle’s multibillion-dollar project-finance package for AI sites in Texas and Wisconsin.
How AI is reshaping the investment-grade market
Because most of the hyperscalers carry A to AA ratings, the AI debt wave has been almost entirely an IG phenomenon. The stock of AI-tagged debt is now estimated to be about 15% of the U.S. IG market. The Big Five hyperscalers alone could exceed 5% of the IG index by the end of 2026. Technology overall could reach about 17% of U.S. IG within two years.
Spreads have so far absorbed the supply remarkably well, but not without strain. Even top-tier tech giants like Alphabet and Meta are paying a premium to entice buyers due to the sheer volume of AI debt.
The real pressure, though, has been on Oracle, a lower-rated, less financially secure company. The cost to insure Oracle’s debt against default has skyrocketed, a sign that investors are not ignoring the financial risks such companies take on.
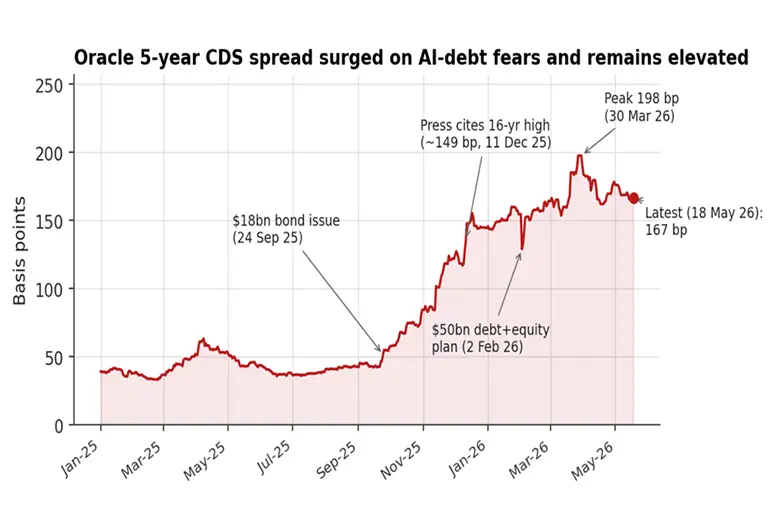
The credit default swap (CDS) shown in the figure above crystallizes the central credit concern: AI CapEx is now growing faster than operating cash flow for several issuers.
Expectations for hyperscaler CapEx in 2026 climbed from $296 billion at the start of 2025 to over $690 billion by mid-May 2026, according to Capital IQ, implying that, in aggregate, the group will spend almost all its operating cash flow on CapEx alone.
For Oracle, projected 2026 CapEx is about twice as much as operating cash flow. While smaller, Amazon is also expected to have CapEx exceeding operating cash flow in 2026. For these companies, the remaining gap will be closed with debt or equity.
For Alphabet and Meta, the cash-flow buffer is narrow but positive. Only Microsoft is expected to retain meaningful headroom.
Beyond the issuers: Which industries are most exposed to AI?
Tracking hyperscaler bonds only tells half the credit story. Equally important, and often overlooked, is the question of which sectors of the real economy will see margins, employment and pricing power reshaped by AI deployment, and whether those sectors are entering this transition with comfortable balance sheets.
One of the most-cited academic measures of industry-level AI exposure is Felten, Raj and Seamans’ AI Industry Exposure (AIIE) index. It produces an AI Occupational Exposure score (AIOE) for each occupational classification, based on the prevalence and importance of a particular ability within each occupation. Higher scores indicate that an industry’s task mix relies more heavily on abilities at which current-generation AI is improving fastest.
The higher AIIE spots are dominated by financial and business-information industries: securities/commodity contracts, followed by accounting and tax services, insurance and benefit funds, legal services, insurance brokerages, nondepository credit intermediation, other investment pools and funds, and insurance carriers. Software publishers come in 9th, and credit intermediation, including banks, 12th.
At the other end, the least-exposed industries involve physical labor: crop production, building services, foundation contractors, slaughterhouse workers, building finishing, and warehousing and storage.
The figure below plots the median AIIE z-score for each against the median debt/EBITDA calculated using firm-level financial data for U.S.-headquartered public companies for fiscal year 2025 taken from Compustat.
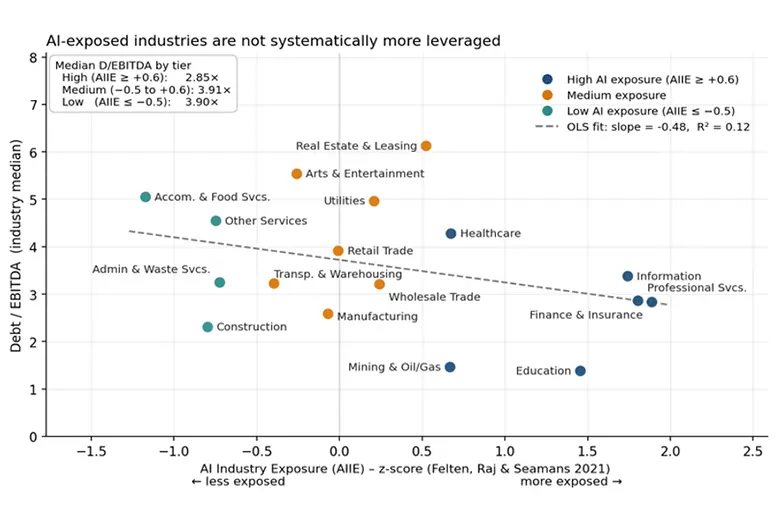
Two observations stand out.
Looking across major industries in U.S. public companies, industries that are more exposed to AI are not carrying more debt than other industries. In fact, the relationship goes slightly the other way: Industries with higher AI exposure tend to have a bit less debt on average.
For example, highly AI-exposed sectors like finance, professional services, technology, education, healthcare and energy have a median debt/EBITDA ratio of 2.85x, which is lower than both medium-exposure industries (3.91x) and low-exposure industries (3.90x).
Meanwhile, the industries with the highest debt levels, such as real estate, entertainment, hotels and restaurants, and utilities, are generally not highly exposed to AI disruption.
Taken together, the takeaway for credit investors is that the most acute AI-disruption risks don’t coincide with the biggest debt burdens, broadly speaking. AI risk and vulnerability are, therefore, inside the highly exposed industries, rather than across the AI economy as a whole.
AI investment is not without risks
The capital market has managed to absorb the massive AI debt wave so far because of three coincident tailwinds: strong demand for high-quality duration; the investment-grade ratings of the issuers; and the contractual asset backing of off-balance-sheet vehicles.
But these investments are not without risk. The long-term viability of the AI investment surge depends on meeting the high expectations embedded in those investments, and any disappointment could result in sharp corrections in both equity and debt markets. Oracle’s CDS episode shows how quickly anxiety about AI demand can spill into credit pricing when balance-sheet headroom is thin.
What lies ahead?
The 2025 hyperscaler bond binge has, in the space of 12 months, turned AI infrastructure into one of the largest growth engines of the U.S. investment-grade market.
Credit markets have absorbed roughly $109 billion of on-balance-sheet bonds and at least $65 billion of off-balance-sheet private credit, without credit spreads widening dramatically.
Yet the structural shifts are real: Tech’s weight in IG indices is rising sharply, off-balance-sheet exposures link hyperscalers to nonbank credit in new ways, and CapEx now meaningfully exceeds operating cash flow for at least one major issuer.
The wider exposure picture is more reassuring than headlines suggest. The industries that AI is most likely to disrupt are, on average, no more leveraged than the rest of the economy, at least for U.S. public companies.
For credit investors, that argues less for a broad derisking from AI exposure, and more for selective scrutiny of issuers whose business models combine heavy task-level exposure to AI substitution with already-stretched balance sheets.
A version of this article first appeared in the Citi-IESE Credit and Debt Markets Project newsletter. To receive the newsletter on current trends, research findings and the latest academic perspectives on credit and debt markets, sign up here.
READ ALSO:
A reality check for private credit markets